
When an employee gets hurt at work, most owners think about the claim first. The claim is real, but it isn’t the whole cost. An injury is an operational event. It pulls a trained person off the floor, shifts work onto everyone else, disrupts a schedule you built for a reason, and leaves a mark on your history that can shape future underwriting conversations. The paperwork is the smallest part.
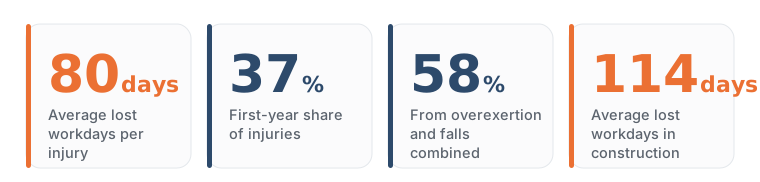
The clearest number in the 2026 Travelers Injury Impact Report isn’t a dollar figure. It’s time. Across all industries, the average injury cost 80 lost workdays. That’s roughly sixteen work weeks of someone not doing their job. Read that way, workers compensation stops being an abstract line item and starts looking like what it is, a measure of how disruption hits your business when something goes wrong.
The biggest takeaway: injuries cost time, not just money
It helps to reframe workers comp around disruption. Premium is what you pay to transfer financial risk. Lost workdays are what you absorb in real life whether or not a claim is filed. The report puts a clear number on that second cost, and it’s large.
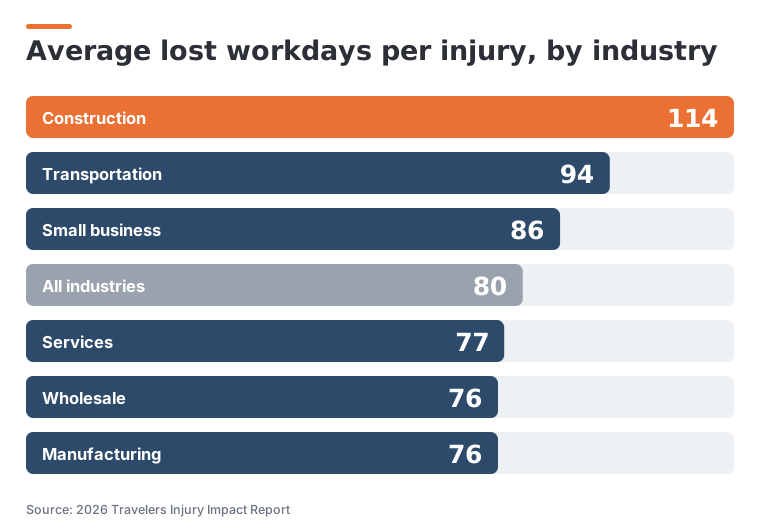
The all-industry average is 80 lost workdays, but the spread matters. Construction sits at 114 days. Transportation is at 94. Small businesses average 86 days, above the overall figure, which is worth sitting with. A larger company can shuffle staff to cover an absence. A small operation often cannot, so a single long recovery can strain the whole team. The lesson isn’t that one industry is careless. It’s that the same injury can cost very different amounts of time depending on the work and the size of the shop.
First-year employees are one of the clearest risk signals
If the report points to a single controllable pattern, this is it. About 37 percent of injuries involved employees in their first year on the job. Those injuries added up to more than five million missed workdays and roughly 34 percent of total claim costs. New workers are a minority of most teams, yet they carry a large share of the harm.
Why new employees get hurt
The reasons aren’t mysterious. New hires are still learning the job, the equipment, the pace, and the hazards. They may not know the safe way to lift, the blind spot on a machine, or when to ask for help instead of pushing through. They often want to prove themselves, which can mean moving faster than their experience supports. None of this makes them bad workers. It makes them the group most likely to get hurt while they learn.
What owners should review
- How much hands-on safety training a new hire actually gets in the first week
- Whether someone experienced is paired with new staff during early shifts
- Whether the physical parts of the job, like lifting and equipment use, are taught, not assumed
- Whether the pace you set during busy periods pushes new people past their training
How it affects workers comp conversations
Onboarding isn’t just a human resources topic. A pattern of first-year injuries can affect your claim history, and claim history is part of how carriers view your business over time. Strengthening new-hire training won’t guarantee a specific pricing result, but it addresses a driver the report ties to a large share of claim costs, and it’s worth reviewing with your advisor and carrier. For industry-specific detail, see our guides for restaurants, contractors, and the broader commercial workers compensation overview.
The two biggest causes: overexertion and falls
Two causes account for the majority of workplace injuries. Overexertion is 31 percent. Slips, trips, and falls are 27 percent. Together that’s 58 percent, well over half of all injuries in the report.
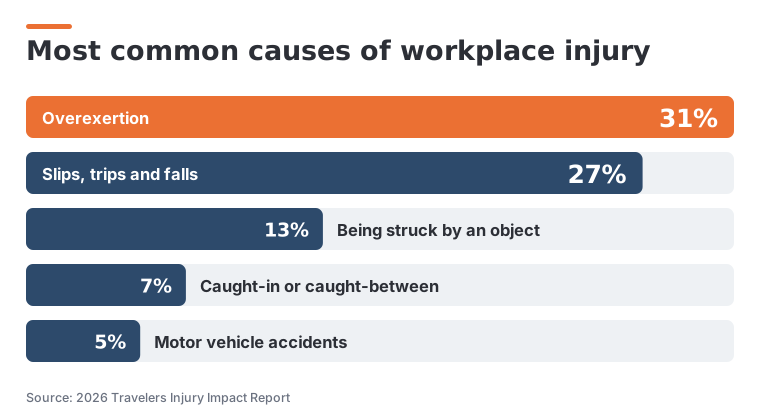
Overexertion is the strain of the body doing too much. Lifting a load that’s too heavy, twisting while carrying something, repeating a motion until a shoulder or back gives out, pushing a cart that won’t move. It’s common because so much work involves moving things, and it’s easy to underestimate until someone is out for weeks.
Slips, trips, and falls are the environment turning against a worker. A wet kitchen floor, a cluttered walkway, an icy loading dock, a ladder on uneven ground, a missed step on a stair. These hazards are ordinary, which is exactly why they get overlooked.
Both categories respond to attention. Questions worth asking as an owner include:
- Do we teach safe lifting, and do we provide equipment for heavy loads
- Are walkways, floors, and work areas kept clear and dry
- Do we’ve a plan for ladders, stairs, and work at height
- During busy periods, do shortcuts around these basics quietly become normal
Common injuries aren’t always the most disruptive
Frequency and severity are two different questions. The injuries that happen most often aren’t always the ones that keep people out the longest, and confusing the two can lead you to focus on the wrong risks.
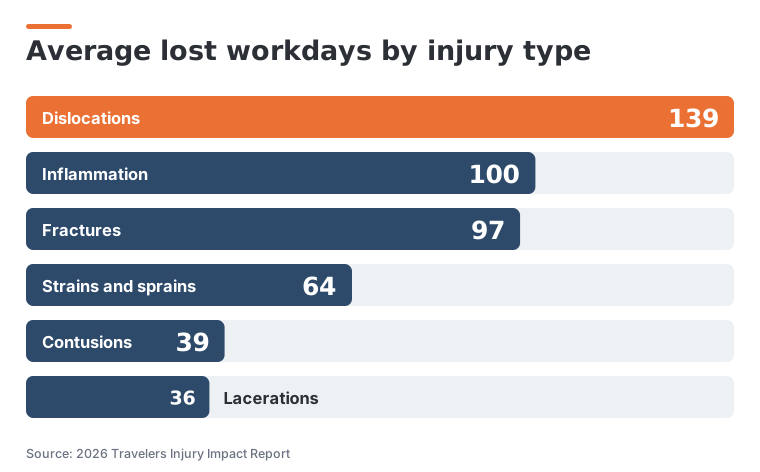
Strains and sprains are the everyday injuries, and they average 64 lost workdays. But dislocations average 139 days and inflammation conditions average 100 days, both far longer absences even though they happen less often. Fractures sit at 97 days. So the most frequent injury type isn’t the one that drives the longest recoveries. A safety approach that only counts how often something happens can miss the injuries that do the most damage when they do occur. Both frequency and severity belong in the conversation.
Large losses come from a familiar set of causes
The report also looks at large workers compensation losses, defined as claims costing 250,000 dollars or more. These are the outcomes every owner wants to avoid, and the striking thing is how ordinary the leading causes are. Slips, trips, and falls. Overexertion. Being struck by an object. Motor vehicle accidents. Caught-in or caught-between hazards.
These are the same everyday exposures from earlier in the report, just at the severe end. A fall is usually a bruise. Sometimes it’s a life-changing injury. The industries most exposed to large losses tend to be the ones with physical work, heavy equipment, or vehicles on the road, where the same incident has more ways to turn serious. Because vehicles show up in this list, exposures like commercial auto and the higher limits available through a commercial umbrella are worth reviewing with your advisor as part of the broader picture.
Construction: longer absences and higher severity
Construction stands apart in the data. Its injuries averaged 114 lost workdays, nearly double the all-industry average of 80. The work is physical, often done at height, and equipment-heavy, and when something goes wrong the recovery tends to be longer.
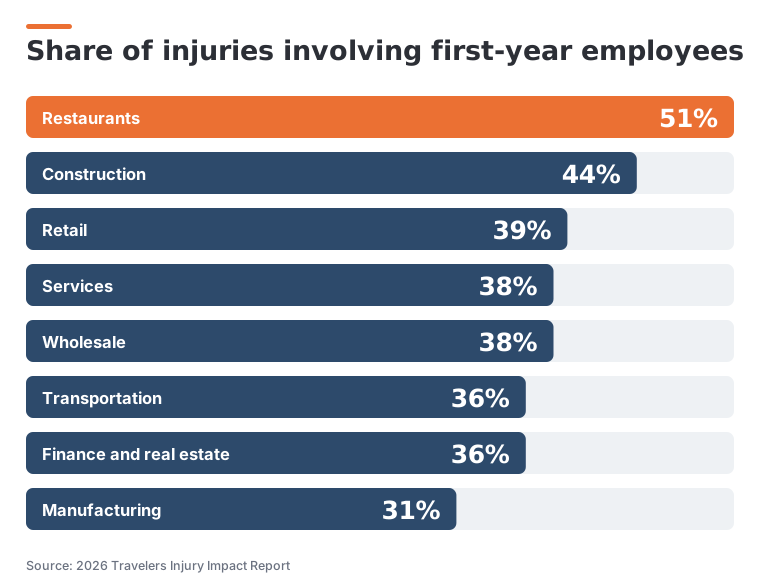
The first-year pattern is sharper here too. About 44 percent of construction injuries involved first-year workers, and those injuries drove roughly 47 percent of construction claim costs. Nearly half the claim cost in the industry traces back to workers still learning the job. For construction owners, that points straight at onboarding, supervision, and how new crew members are brought up to speed on real jobsites. See our contractors hub, the contractor workers compensation guide, our workers comp audit review, and the coverage review for a structured look at your own exposure.
Restaurants: first-year employees deserve attention
Restaurants had the highest first-year injury share in the report, at 51 percent. More than half of restaurant injuries involved employees in their first year. High turnover, fast-paced shifts, hot surfaces, sharp tools, and wet floors combine into an environment where new staff are especially exposed while they learn.
For restaurant owners, this reframes onboarding as a safety investment, not just a scheduling task. Walking new hires through the real hazards of the kitchen and the floor, and pairing them with experienced staff early, addresses the exact group the data flags. Our restaurants hub, the restaurant workers compensation guide, and the coverage review go deeper on this.
Older workers may miss more time after an injury
Experienced workers are among the most valuable people on any team. They know the job, they steady the newer staff, and they often prevent the very incidents this report measures. The point here isn’t that age is a problem. It’s that recovery can take longer, which makes prevention, modified duty, and return-to-work planning matter more for this group, not less.
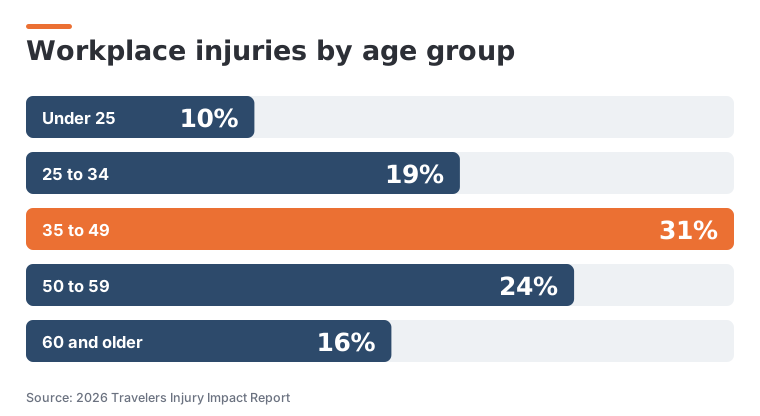
Injuries are spread across age groups, with workers 35 to 49 the largest single share at 31 percent. Where age shows up most is in time away after an injury. Compared with younger workers, employees 60 and older tended to miss additional days: about 10 more in construction, 16 more in manufacturing, 19 more in wholesale, and 22 more in small business. The takeaway is practical and respectful. Keeping experienced people safe, and having a real plan to ease them back into work after an injury, protects both the person and the operation.
Return-to-work planning belongs in the workers comp conversation
One of the more encouraging findings in the report is specific to Travelers. Using its own programs and capabilities, Travelers reported that roughly 70 percent of injured employees returned to work within 30 days. That’s a Travelers result tied to Travelers resources. It isn’t a guarantee for every employer or every carrier, and your own outcomes depend on your program, your carrier, and the facts of each injury.
Still, the underlying idea is sound and worth discussing with your advisor. A thoughtful return-to-work approach, with light or modified duty available while someone recovers, may help shorten absences and support the injured worker. It can also affect how claim time develops, which is part of what shapes your history over the years. Whether a formal program fits your business is worth reviewing with your carrier, especially in industries where recoveries run long, such as professional services where the work and the exposures differ.
What to review before your next workers comp renewal
The report is most useful when it turns into a short list of things to check. Before your next renewal, walk through these with your advisor and carrier:
- Onboarding and new-hire safety training, since first-year workers carry an outsized share of injuries
- Your two biggest likely causes, overexertion and falls, and what you do to reduce them
- Class codes and classifications, so payroll sits in the right category
- Payroll estimates, so your exposure base is accurate for the coming term
- Claim history, and what it does and doesn’t say about your operation
- Whether you’ve a written return-to-work plan and light-duty options
- How supervisors respond in the first hours after an injury
- Driver and vehicle exposure, given how often motor vehicles appear in large losses
- The specific hazards of your industry, from kitchens to jobsites to warehouses
- Whether any available safety or return-to-work program actually fits your business
A structured coverage review or renewal review is the natural place to work through this list, and for smaller operations a business owners policy may bundle several coverages worth examining at the same time.
Bottom line
The 2026 data tells a consistent story. Workplace injuries are operational events measured in lost time, they land hardest on newer employees, and they come mostly from ordinary causes like overexertion and falls. None of that’s out of an owner’s reach. Better onboarding, attention to the two biggest causes, accurate classifications, and a real plan for getting people back to work are the levers the report keeps pointing to. We cannot promise any of these will change your premium, prevent a claim, or guarantee an outcome. What we can say is that they address the exact patterns the data highlights, and they’re worth reviewing with your advisor and your carrier before your next renewal.
Questions to ask your advisor
- Are my class codes and payroll estimates accurate for the work my team actually does
- Given my industry, where does my exposure line up with the report’s biggest causes
- Does my claim history show a first-year injury pattern I should address in onboarding
- What return-to-work or light-duty options are realistic for a business my size
- How might my current safety and training approach affect future underwriting conversations
About this data
This article references the 2026 Travelers Injury Impact Report, which analyzed more than 1.2 million workers compensation claims from accident years 2021 through 2025, excluding COVID-19 and zero-dollar claims. The figures cited here come from that report and are used for education only. Travelers didn’t sponsor or endorse this article, and it’s one data source among many. You can view the report directly at view.ceros.com/travelers/injury-impact-2026.
Data like this is a starting point, not a verdict on your business. Your industry, your team, your history, and your state all shape what actually applies to you, and the only way to know is to look at your own program with someone who can compare it across carriers.
Want guidance first? Compare your coverage. Already know what you need? Get a quote.